|
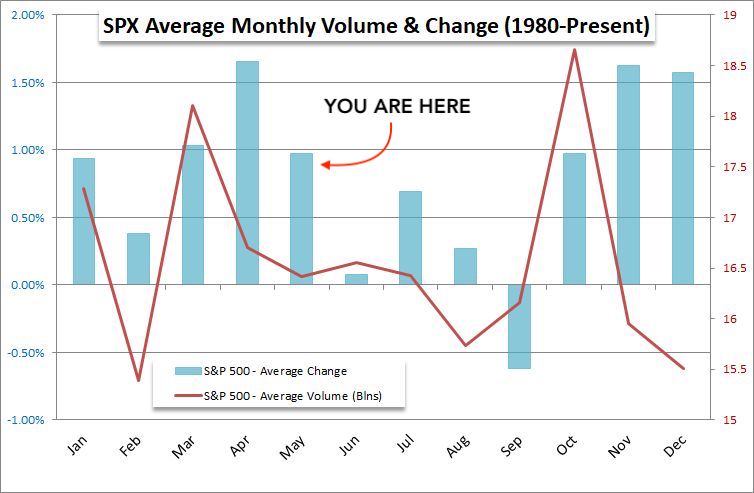
This chart shows the average return, by month, for the S&P
500 SPX. The red line shows average trading volume |
|
00:01 - 03/05/18 |
|
|
|
|
|
 |
|
|
|
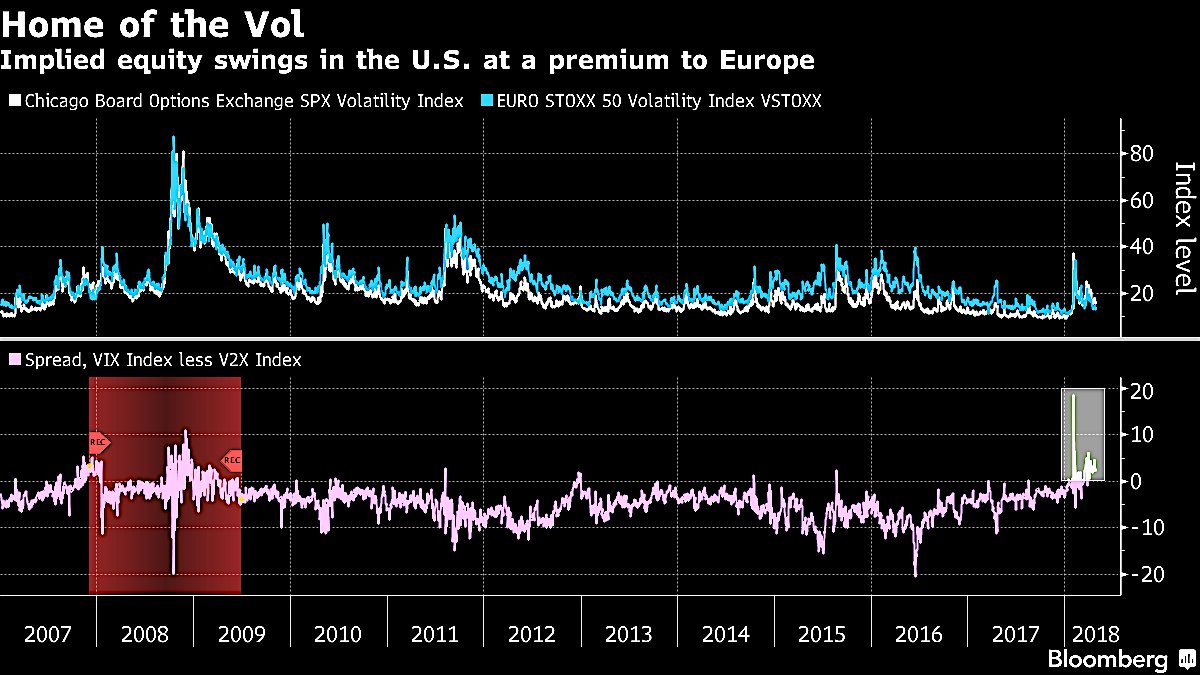
America has become the largest exporter of turbulence thx to
Trump comments und rising rates: Global market volatility
now a ‘Made in the USA’ phenomenon. Implied vol of US
stocks
runs consistently higher than in Europe for first time since
GFC |
|
|
|
 |
|
|
|
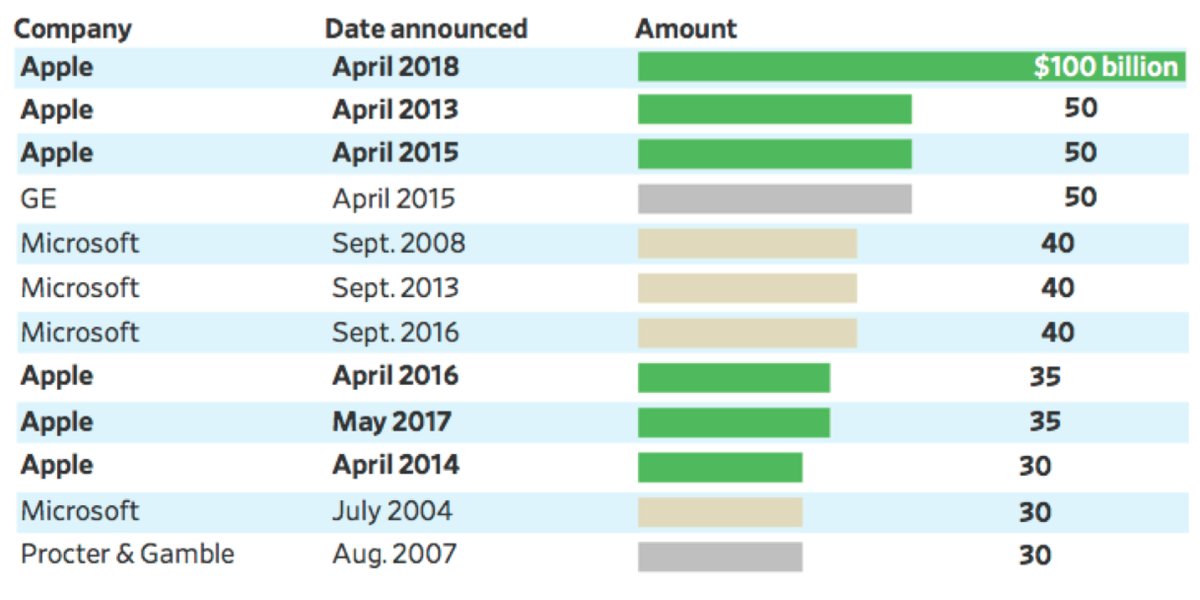
Apple has dropped $300 BILLION buying back stock since 2013.
That's 33% of its current market cap. It's also bigger than
the market caps of Walmart, Wells Fargo, AND Intel |
|
|
|
 |
|
|
|
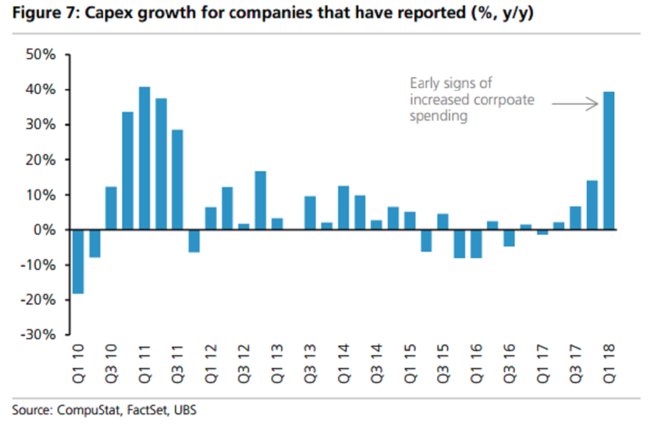
This chart shows year-over-year CapEx growth for S&P 500
companies. That means the amount of money companies are
spending to upgrade or maintain property, buildings, or
equipment.
CapEx is currently growing at its FASTEST pace since 2011 |
|
|
|
 |
|