|
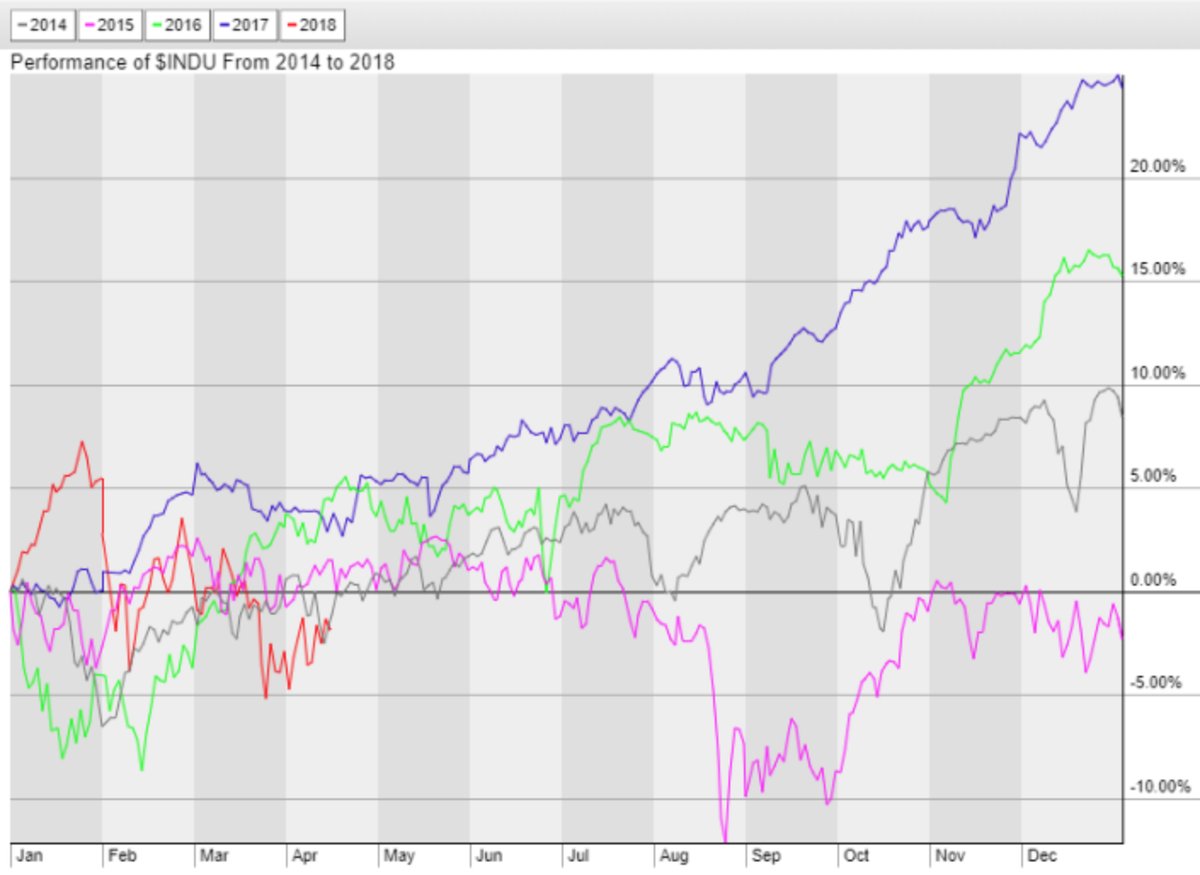
Here's how the Dow Jones Industrial Average
DJIA has
traded since 2014 |
|
00:01 - 18/04/18 |
|
|
|
|
Each year is shown on this chart:
2014 grey line +7.5%
2015 pink line -2.5%
2016 green line +16%
2017 blue line +27%
2018 red line -2%
 |
|
|
|
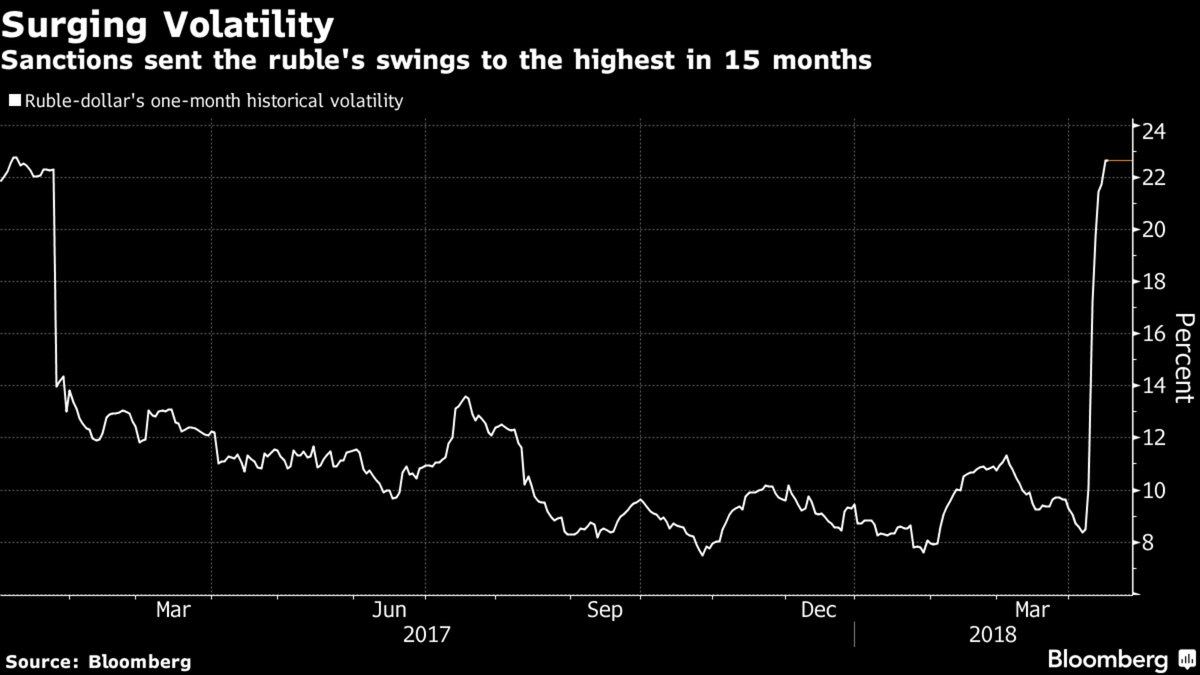
Russian stocks rally on a report that Trump won't rush out
new sanctions |
|
|
|
|
|
|
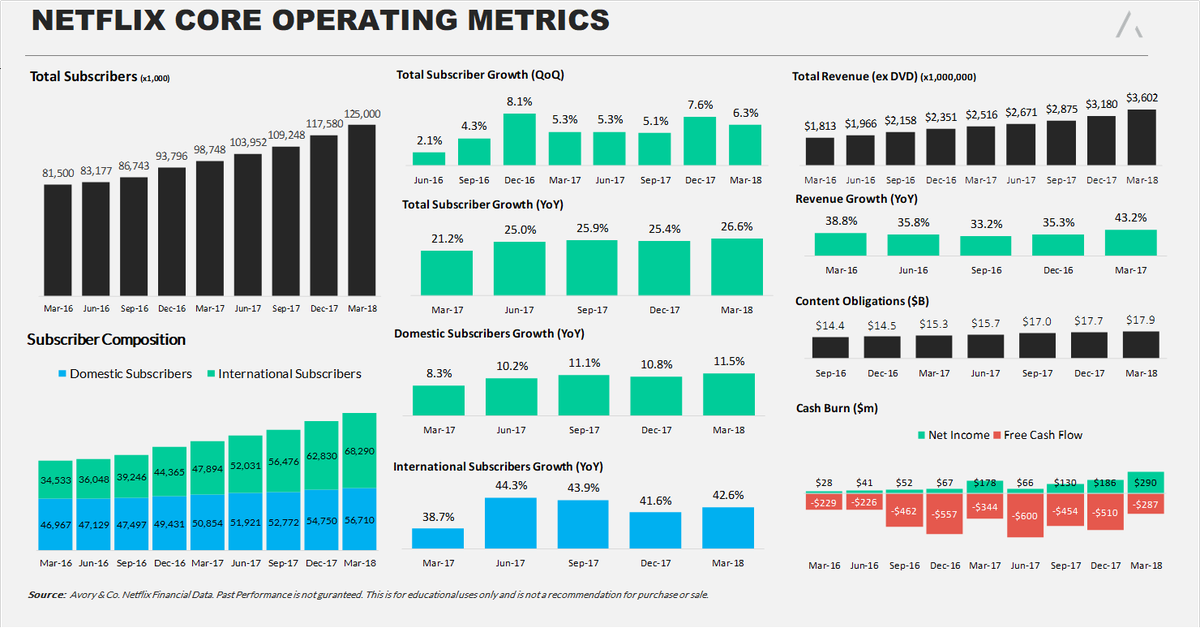
Here are the 10 most important things to know about Netflix.
All on one visual. They now have 125 million subscribers |
|
|
|
|
|
|
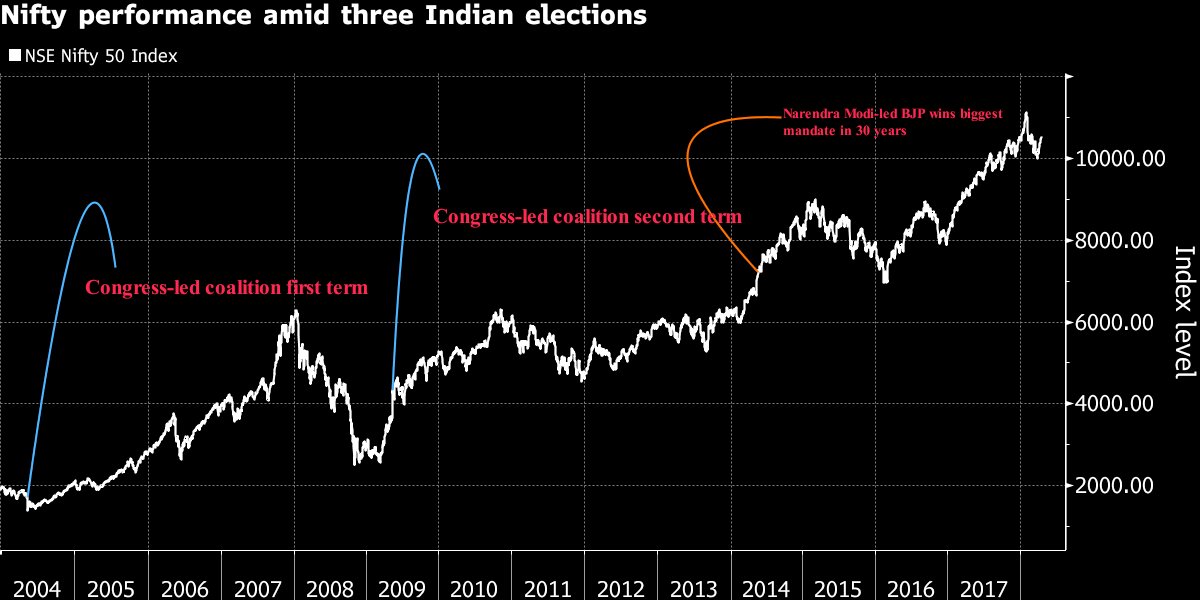
Uncertainty about India's election result is likely to hurt
stocks,
Morgan Stanley says |
|
|
|